
years, and SCU is still with you at every stage of your financial life.
Scott Credit Union exists to help our members and community learn, grow, and achieve financial goals.
What's New
Check out the latest news and offers for Scott Credit Union members.
")

")

")
")
We’re Proud of Our Military Background and where we started.
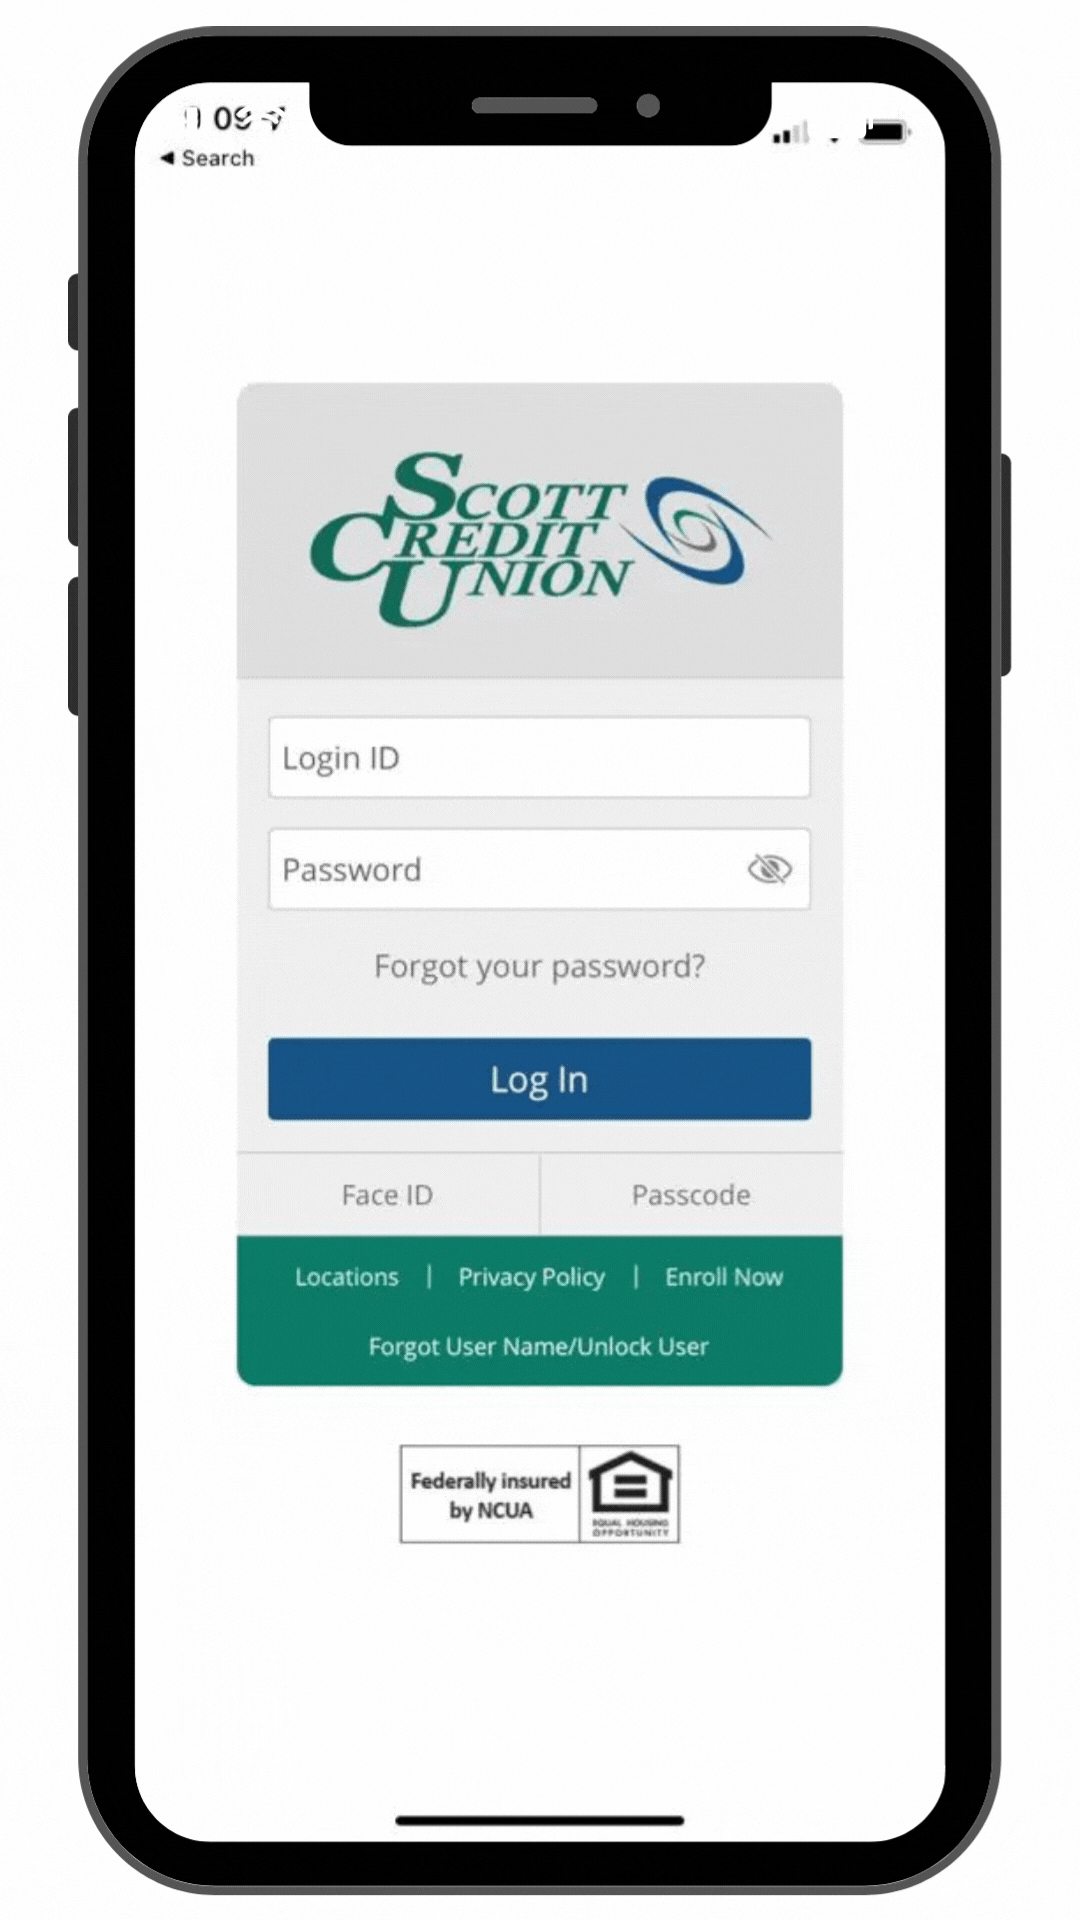
Get the SCU Mobile App
These key features make banking and account management a snap with the Scott Credit Union Mobile App. Download the app and take your banking mobile today!


Join Our Team
Scott Credit Union employees are knowledgeable, resourceful, and provide excellent member service. If this sounds like you, we invite you to explore our current job openings and apply to join the SCU team.
Join the SCU Team!

")